Soaring Free Range build costs
Published on : 26 Feb 2026
How much does it really cost to bring a greenfield site into production?
According to ADAS costings published in this magazine, the capital cost of building a brand-new free-range house has risen 58% in the past decade, from £30 per bird placed in February 2016 to £47.50 in the most recent edition. That’s a rate of inflation that considerably outstrips the Bank of England’s reported rates, based on consumer price indices (CPI) from the Office of National Statistics. A quick trip to the Bank’s helpful online calculator tells us that to match the purchasing power of my £30 in 2016 would require £41.69 in today’s money, a rise of ‘only’ 39%.But if you’re still reading and you’ve made any recent enquiry into the cost of either building a new shed or even refurbishing your existing unit, you may well be screaming at this article to say ‘it costs a lot more than £47.50 per bird to build a chicken shed!’ Or words to that effect. And you’d be right. This raises two immediate questions. How much does it really cost to bring a greenfield site into production? And why do we under-report the true cost of this investment? We’ll explore both of these points as well as a potted history of why there has been such a dramatic rise in build costs in recent years. Pre-Brexit blissFirst, though, with the help of the Ranger back-catalogue, we’ll take a trip in the ADAS time machine back to February 2016. In the near-quarter of a century since the global recession of the early 1990s, inflation had been steady and stable around 2%. For context, David Cameron was in No.10, the world was worried about a global health emergency (Zika), Taiwan suffered a deadly earthquake and war raged in Afghanistan and the Middle East. Whilst the US were in the pre-election processes that would give Trump his first term in office, the UK Government announced the referendum on the country’s membership of the EU. And a clock started ticking. Meanwhile, looking through the lens of the ADAS contract egg production costing, a typical free range farm housed 12,000 pullets costing £3.97 each, producing 300 eggs to 72 weeks for a market price of 96 pence per dozen. Feed was a shade over £200/t. Return on investment stood at less than 1% in year one. Yes, it’s fair to say things have changed. And whilst the £30 per bird build cost estimate a decade ago would still have stimulated animated discussion, there would likely have been more consensus than in an equivalent debate today. The only person in the conversation who would argue that it costs £1.5million to build a 32,000-bird house now is the supermarket buyer! In their defence, that is the information we’re presenting them with. Trade insights from those in the knowSo, what does it really cost? Closer to £70 per bird. Richard Buchan, the respected and experienced area sales manager for Big Dutchman distributor Newquip, brings some precision to the debate. He puts the figure at £67.35. Few would know better than Richard. But he would also contest the starting position of £30, suggesting it was already much higher, nearer £40 per bird in 2016. From either figure, the proportional increase is huge, but why? We asked Richard. “The world changed after Covid, and the war in Ukraine, so using annual inflation figures would not really give the full picture. There are a whole host of underlying changes across the global supply chains that deliver a building in this country. Take motors and drives as an example. These are technical pieces of equipment, manufactured abroad, where the cost of employment has risen rapidly. Shipping costs equally so. It isn’t just a matter of local cost inflation or raw material price shifts. It’s a compound effect of worldwide changes.” Donald Gillespie, director at leading shed builder Morspan, lists many of the same factors as Richard, “The only other thing to add would be legislative, for example the extra or larger pop holes, or the changes to edge protection rules. But these values are relatively small. Labour costs, in fabrication and on site, continue to be the biggest inflationary factor,” before adding, “on the civils side, the change to red diesel in quarrying and construction sites has had an impact.” Since April 2022, the construction industry must use white rather than red diesel in their machinery, thereby losing the benefit of the substantially lower rate of excise duty. Highlighting the demand for man and machine in the construction trade and national infrastructure projects, Donald said, “HS2 has impacted civils build costs throughout England, not just in the narrow corridor the train line itself sits in.”UK-specific inflationary forcesHS2 and fuel duty aside, many of Donald and Richard’s listed influences are indeed global, and Covid-19 as well as the economic shock created by Russia’s invasion are partially to blame, each casting long shadows that linger today. But the UK has its own particular headwinds too. Although the Brexit referendum was decided in 2016, much of the accompanying legislation took another 5 years to understand let alone take effect. A(nother?) period of regulatory uncertainty that unhelpfully coincided with the pandemic helped to turn the UK into an island of hyper-inflation in labour cost as swathes of skilled workers sought greater security and reward abroad. And then there were the 49 days of Liz Truss. Although in recent years the rates of inflation in our country are equivalent to the Eurozone, we’ve arguably baked in the steeper climbs of 2020 and 21. Beyond our immediate economic horizons, trade wars between US and China, and then US and seemingly everyone, as well as issues such as a shortage of semi-conductors or concerns over rare earths have kept the pot simmering. Local mattersThere are many variables on each individual site that determine the final build cost. Planning cost, site topography, proximity to utilities and the approach of the service providers all come under the heading of PC Sum, or prime cost. But in the main items of shed, equipment and groundworks, the factors that have driven inflation are not expected to unwind and the volatility that has supported their rise in cost over the past decade seem set only to continue, at least in the near future. Ranger canvassed other views for indicative total project costs, and the chart below shows these plotted against each February Ranger since 2016. You can see that there isn’t complete alignment in the starting point ten years ago, but from 2020 onwards, the trade insights are closely matched. The lag in the price published in our costing is clear to see, and has never been greater than the present day, at a £20/bird disparity.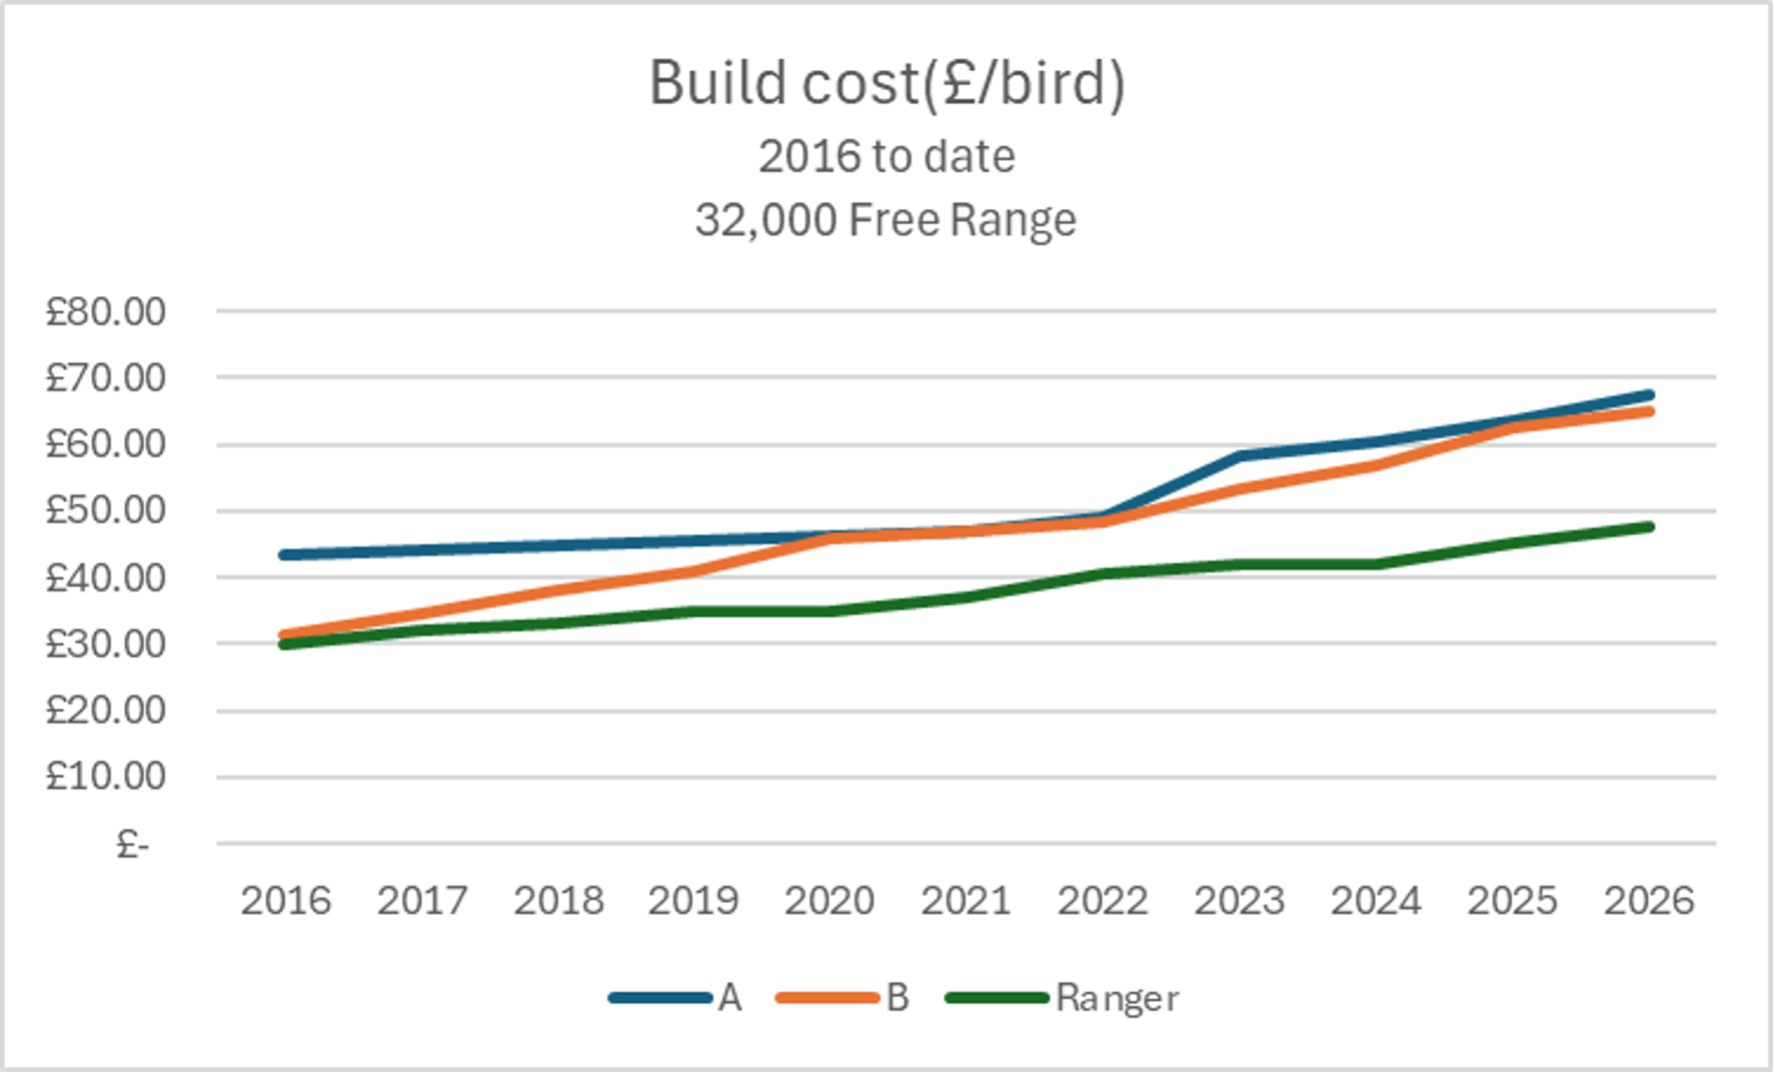
Ranger canvassed other views for indicative total project costs, and this chart shows these plotted against each February Ranger since 2016
Why do we under-report the build cost?The working group that convenes with ADAS to evaluate the regular cost of production reports preside over a difficult conundrum when it comes to reporting the capital cost. Separated by only a handful of years in operation, two very similar sites can have an enormously different establishment cost. Currently, the ADAS costing reports a ‘middle of the road’ average for sites constructed over recent years, but there is an argument to say that the current value should be incorporated. The counter argument speaks to the concern that margins are already well above any long-term average and, with many free-range egg contracts directly linked to the ADAS document, further inflation could prove a heavy straw upon the back of the proverbial supermarket camel. In reality, only a fraction of eggs are produced carrying the burden of current build costs, and it is deemed a fair representation to attempt to weight the published figure based on an estimated number of houses being brought into production in any given year at an up-to-date price. One thing is for sure, with the rapid rate in expansion in the last 2 years, the printed price is only heading in one direction.